One live operational picture.
Raw readings are not situational awareness. The Senselink platform turns a field of nodes into a picture an operator can act on in seconds — and a record a regulator can rely on later.
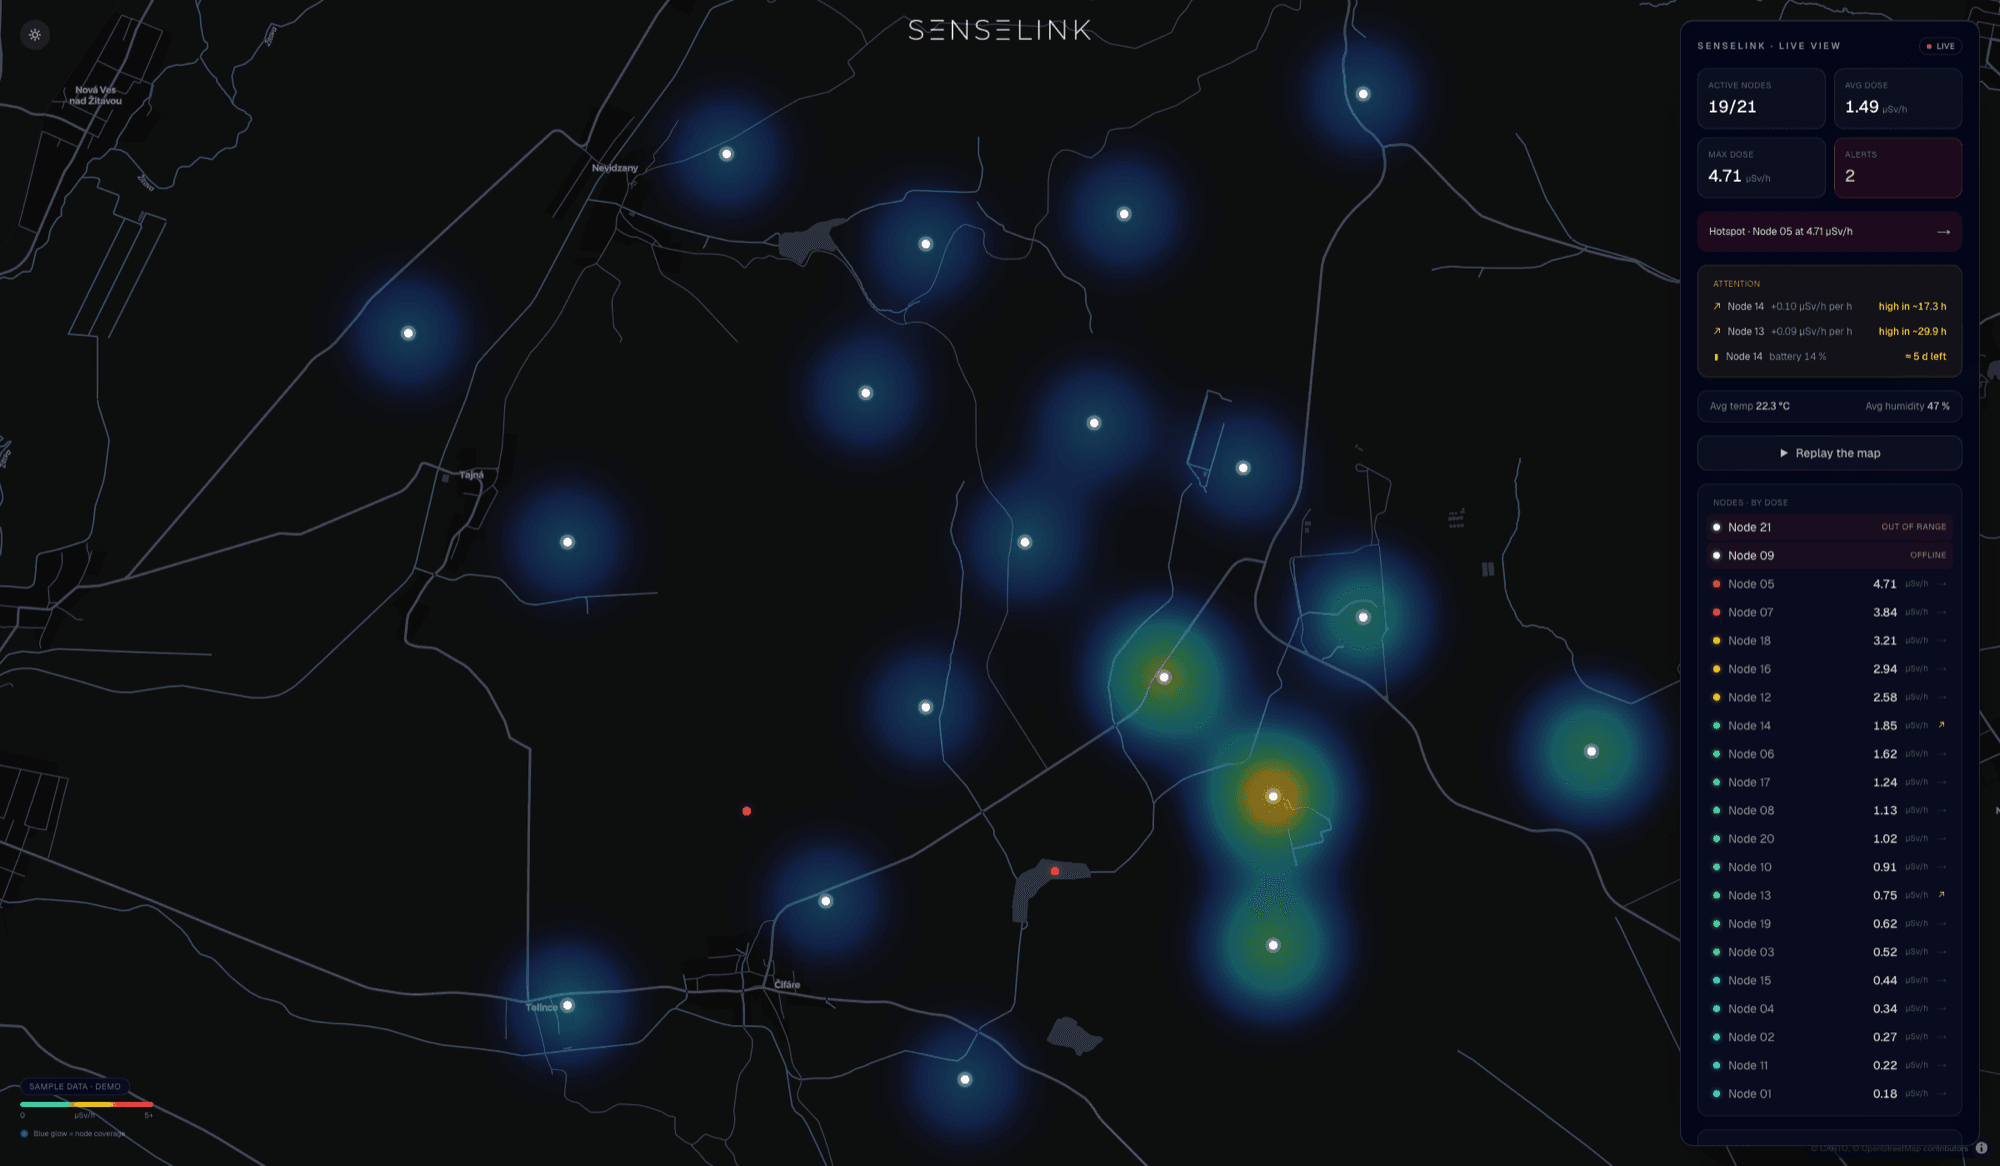
Everything between a reading and a decision.
Live map & heatmap
Every reading lands on one fluent map — hotspots, gradients, and drift rendered the way an operator actually reads a situation, not as a table of numbers.
Alerts & thresholds
Set dose-rate thresholds per zone or per node. When a value crosses the line, the right people know in seconds — on the dashboard and beyond it.
Fleet & node health
Battery state, link quality, GPS lock, and uptime for every node in the field — so you know the network is healthy before you need to trust it.
History & export
Full measurement history per node and per area, ready for reporting, regulatory documentation, and post-incident analysis.
Network awareness
The platform shows how data is flowing — LoRaWAN uplink or mesh fallback — so a degraded network is visible long before it becomes a blind spot.
API & integrations
Readings are available over an API for command-and-control systems and partner tools. Bring your sensor, and its data arrives through the same pipeline.
From the field to the screen.
Platform
One live picture: map, alerts, history
Action
Operators, commanders, and connected systems
The platform is sensor-agnostic — radiation is where we start.
Dashboards, alerting, fleet health, history, and the API work the same for any payload the node carries. Sensor partners get deployment, connectivity, and a full data product around their hardware — without building any of it.